> For the complete documentation index, see [llms.txt](https://docs.hackle.io/llms.txt). Markdown versions of documentation pages are available by appending `.md` to page URLs; this page is available as [Markdown](https://docs.hackle.io/en/ab-test/a-b-faq.md).
# A/B Test FAQ
Frequently asked questions about designing, running, and interpreting A/B Tests.
Frequently asked questions about designing and running A/B Tests in Hackle.
#### How many users do I need to run a test?
There is no fixed minimum number of users. That said, 100 or more daily users is preferable.
***
#### Can I run a test without statistical knowledge?
Yes. Hackle presents the statistical significance of results visually.
You can check results for goals such as button click rate or purchase conversion rate. Statistical knowledge helps when you analyze raw data further.
***
#### What should I keep in mind when analyzing results?
Run the test for at least 1\~2 weeks. Do not end a test early based on temporary results.
{% hint style="warning" %}
At least 1 to 2 weeks are needed to reduce distortion caused by day-of-week effects. Ending a test early can lead to distorted conclusions.
{% endhint %}
***
#### Why do the values differ between A/B Test and Data Analytics for the same metric?
Because the two features aggregate at different points in time.
An A/B Test calculates the denominator and numerator events that occur after the distribution point. Data Analytics calculates simply whether an event occurred.
Unlike an A/B Test, which reflects the order of events, Data Analytics does not consider it. Therefore, values can differ even for the same metric.
***
#### What problems occur if sample sizes are not even across groups?
The variability of a small group can be reflected excessively, which may distort the p-value. This can lower the reliability of the results.
***
#### What happens if I drop some test groups while the experiment is running?
Users in the dropped group are excluded from the experiment. Those users see the Group A screen. The experiment continues with the remaining groups.
***
#### What happens if I select a Winner group in an experiment where only part of the traffic is allocated?
All traffic is distributed to the Winner group. Users who do not meet the targeting conditions are assigned to Group A.
***
#### Is data generated on Test Devices reflected in the experiment results?
Generally it is not. However, it can be reflected if the user was already exposed before the Test Device was registered.
***
#### Why include non-experiment users instead of looking only at treatment groups?
Because when the change is actually rolled out, it applies to all users.
The current behavior level of non-experiment users has a large impact on the Site-wide result.
***
#### If the experiment participation rate is low, does the Site-wide effect also become smaller?
Yes. The lower the participation rate, the larger the share of existing metrics from non-experiment users.
As a result, the Site-wide effect is diluted.
***
#### Can I predict company-wide rollout from an experiment targeting only a specific OS or cohort?
Yes. Even an iOS experiment is calculated from the perspective of all users, including Android.
However, if behavior differs greatly by OS or by cohort, the prediction accuracy can vary.
***
#### Are there metrics that cannot be selected as Global Impact metrics?
Event metrics whose denominator is the total number of exposures are not supported.
Time metrics, funnel metrics, and retention metrics are also not supported.
***
#### My Global Impact metric results are not calculated.
Unlike other metrics, Global Impact metrics are calculated once per day.
***
#### I need the A/B Test raw data.
{% hint style="warning" %}
Data extraction is available on **paid plans of Enterprise or higher**.
{% endhint %}
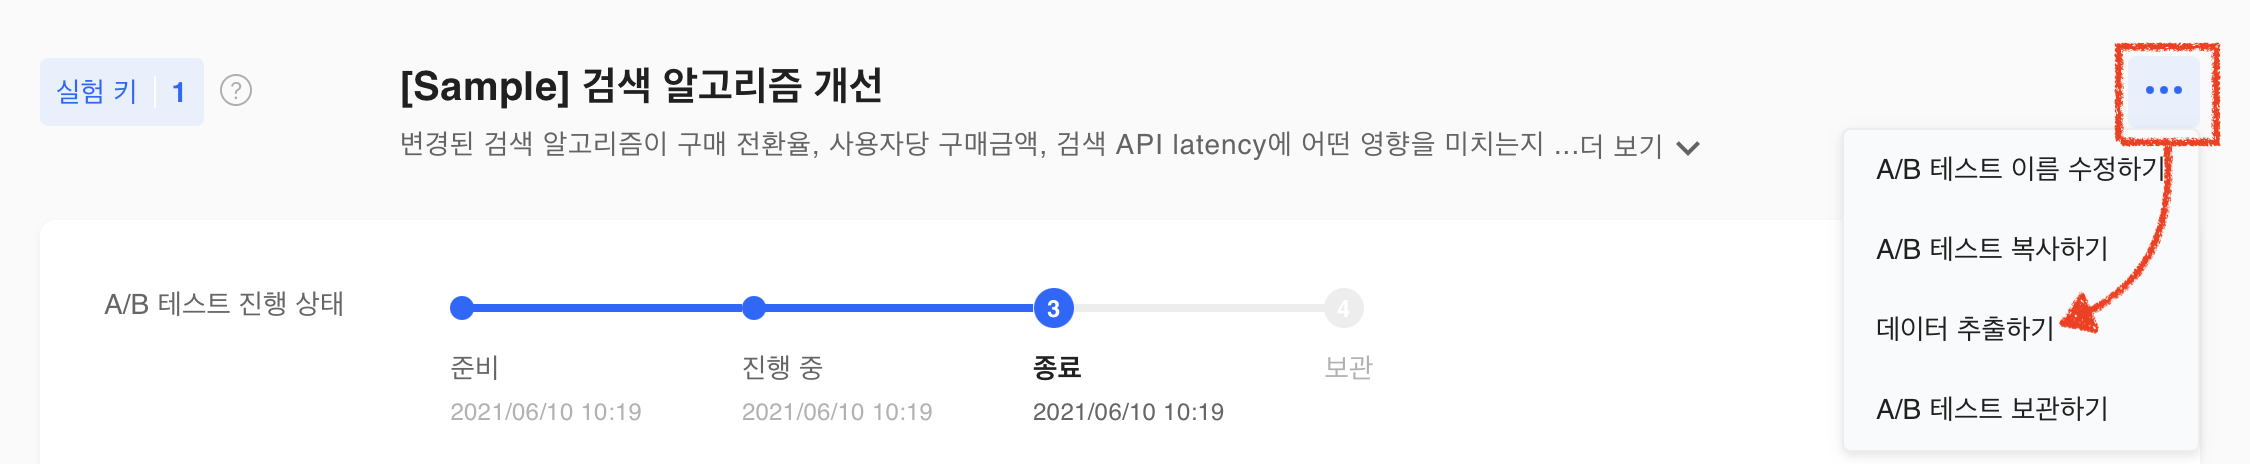
You can extract variation distribution data and event data from the Dashboard.
{% stepper %}
{% step %}
**Select a test**
Go to the detail screen of the A/B Test whose raw data you need.
{% endstep %}
{% step %}
**Request the data**
Select **`...`** to the right of the title → **Extract Data**.
{% endstep %}
{% step %}
**Download the CSV file**
Download the CSV file from the link sent to your registered email.
{% endstep %}
{% endstepper %}
---
# Agent Instructions
This documentation is published with GitBook. GitBook is the documentation platform designed so that both humans and AI agents can read, navigate, and reason over technical content effectively. Learn more at gitbook.com.
## Querying This Documentation
If you need additional information that is not directly available in this page, you can query the documentation dynamically by asking a question.
Perform an HTTP GET request on the current page URL with the `ask` query parameter, and the optional `goal` query parameter:
```
GET https://docs.hackle.io/en/ab-test/a-b-faq.md?ask=&goal=
```
`ask` is the immediate question: it should be specific, self-contained, and written in natural language.
`goal` is optional and describes the broader end goal you are ultimately trying to accomplish on behalf of the user. GitBook uses it to tailor the answer towards what is most useful for that goal.
The response will contain a direct answer to the question and relevant excerpts and sources from the documentation.
Use this mechanism when the answer is not explicitly present in the current page, you need clarification or additional context, or you want to retrieve related documentation sections.